Watch my PhD Defense: Biofilms in the Continental Subsurface
I recently finished up my PhD and defended on April 22, 2021, aka Earth Day. Check out the video below to watch my defense and get a taste of what I worked on for the past five years!

Using a Green Screen in Premiere Pro
Hello! Today I want to share a quick tutorial on how to use a green screen in Adobe Premiere Pro! Premiere Pro is a video editor in the Adobe Creative Cloud suite that’s got a ton of great features that make movie making a breeze!

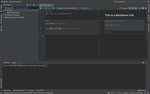
Jupyter notebooks in PyCharm
Today we’re going on a Python adventure using Jupyter notebooks and PyCharm! First, let’s talk about what these are. Jupyter Notebook is a web application where you can create interactive coding documents, supporting many programming languages including both Python and R as well as Markdown.
Making beautiful interactive slides with revealJS
Today I’ll show you how to spice up your presentations with revealJS in R. This is an HTML presentation framework that allows you to share your slides on the web, add custom animations, embed websites into your slides, and more!

Thermodynamic Modeling with CHNOSZ
Are you curious what sorts of metabolic processes might be occurring at your study site? Using in situ geochemical data, you can model the Gibbs free energy available from metabolic reactions and predict which metabolisms are energetically favorable!
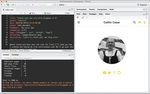
Create your own site with blogdown in R
Wanna create and host your own site for free? I’ll show you how I created and hosted my site caitlincasar.com! We’ll go over the two basic tools I used: the blogdown package in R and Github Pages.
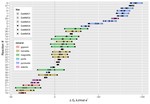
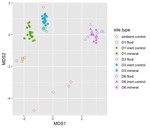
Making figures for microbial ecology: Interactive NMDS plots
This is the one of several tutorials I’m putting together for making figures that are common in microbial ecology. Today we’ll create an interactive NMDS plot for exploring your microbial community data.
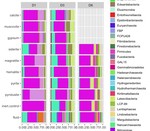
Making figures for microbial ecology: Interactive bar plots
Fork This is the first of several tutorials I’m putting together for making figures that are common in microbial ecology. Today we’ll start with an interactive bar plot for exploring your microbial community data.